How to Improve HCX Performance
By: Dennis Boeynaems @DennisBoeynaems
This article is about how to troubleshoot suboptimal performing migrations levering HCX in the context of Azure VMware solution
Architecture
As a reminder here’s a quick recap on how HCX can be setup
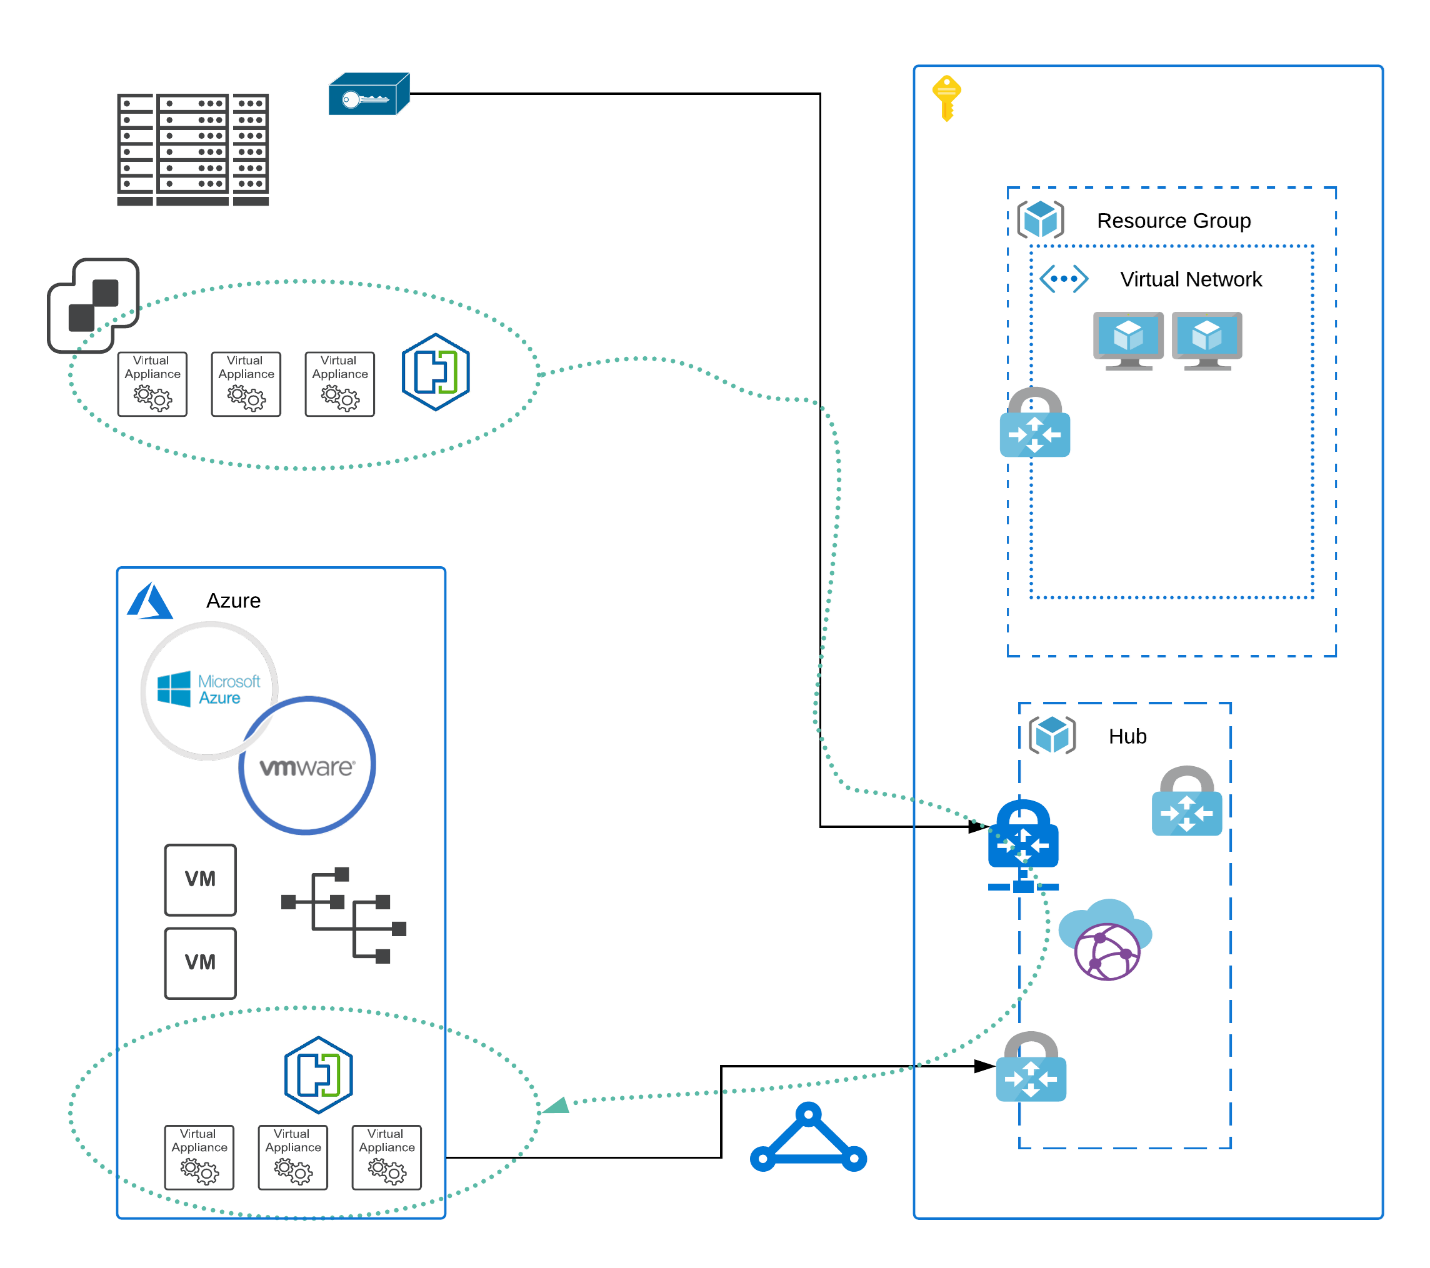
HCX Over Express Route
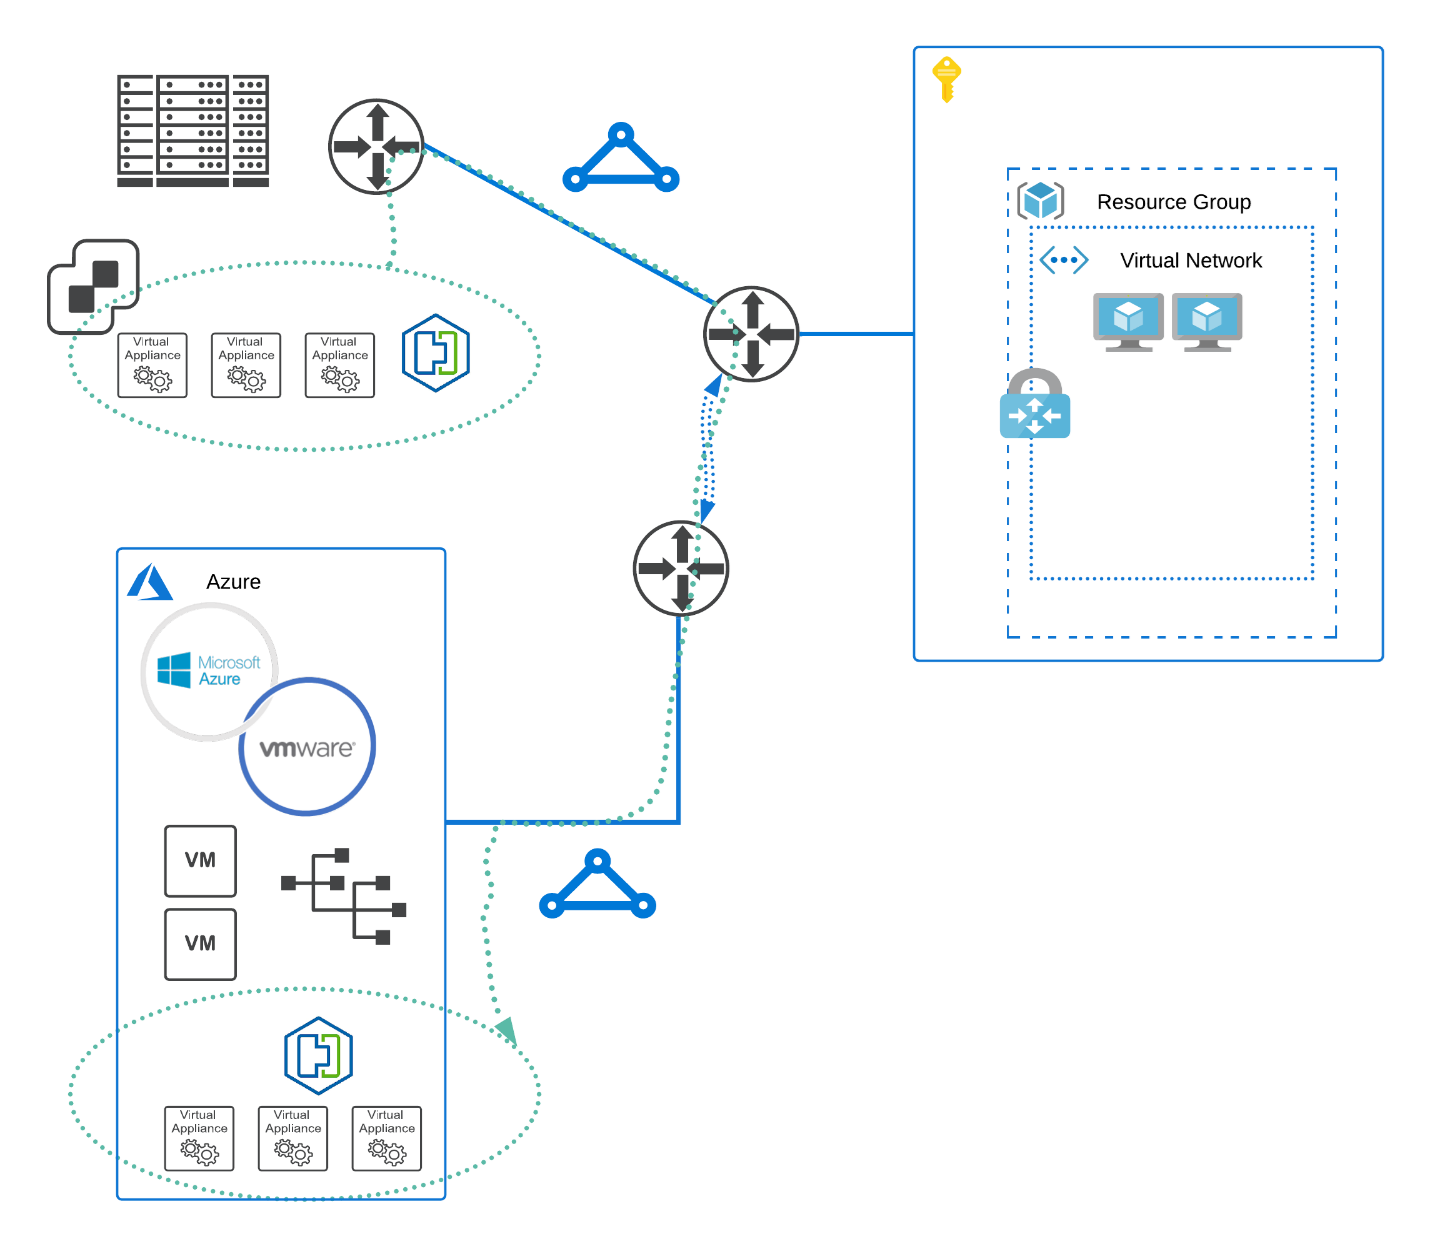
HCX’ control pane on-premise is often referred to as “the connector”. The AVS HCX is controlled by “the manager”. The actual migrations themselves as well as the L2VLAN stretch are supported across the so-called ‘service mesh’. This consists out of a maximum number of 5 appliances:
The most relevant being:
- IX: The interconnect appliance
- NE: Network extension, the appliance responsible for the high performance of VLAN extension
- WANOP: Line conditioning and deduplication
Getting access and see how they perform is done by accessing the connector (the manager, on the cloud side is not accessible through SSH) directly on-prem. Remember the connector is on-prem, the manager is in the cloud. There is one connector on the source side it is paired to the manager on the cloud side. You cannot connect multiple connectors to each other.
Ssh (or putty if you are on windows) admin@<connector IP address/hostname>
On the prompt type ccli (to get into the HCX central CLI):
[admin]@ list- List all appliances1 2
0 - UAT-SM-IX-I1 - 172.27.103.21:9443 - Connected 1 - UAT-SM-NE-I1 - 172.27.103.22:9443 - Connected
-
[admin]@ go 0- Activate the correct appliance based on the ID column (as shown above)
Here we are selecting the IX appliance (interconnect) as we want to investigate the performance of the interconnect [admin]@ perftest reachability- Validating the service mesh connectivity end to end
This will produce a lot of information if you hit Y on the below question. Results range from simple ping tests, packet transmissions etc.1 2 3 4 5 6 7
========== PERFTEST ALL STARTING ========== == WanOpt is Present == == TOTAL # of TESTs : 11 == == ESTIMATED TEST DURATION : 12 minutes == -T option to change individual test duration [default 60 sec] -k option to skip 'perftest uplink' if tcp port 4500 or 22 not opened == Are you ready to start ?? [y/n]: y
[admin]@ perftest uplink- This is to validate the uplink to for baseline WAN connection verification
Purpose here is to, well validate WAN connectivity measuring bandwidth, RTT, retransmits etc1 2 3 4 5 6 7 8 9 10 11 12 13 14 15 16 17 18
========== Testing UPLINKs ========== Testing uplink reachability… Uplink-0 round trip time: rtt min/avg/max/mdev = 17.086/17.244/17.649/0.223 ms Uplink native throughput test is initiated from LOCAL site. ++++++++++ StartTest ++++++++++ ---------- Uplink-0 [te_0, 172.27.103.21 >>> 172.24.131.50] ---------- Duration Transfer Bandwidth Retransmit server workload started [ 4] 0.00-60.00 sec 931 MBytes 130 Mbits/sec 322 sender [ 4] 0.00-60.00 sec 928 MBytes 130 Mbits/sec receiver Done ---------- Uplink-0 [te_0, 172.27.103.21 <<< 172.24.131.50] ---------- server workload started Duration Transfer Bandwidth Retransmit [ 4] 0.00-60.00 sec 995 MBytes 139 Mbits/sec 445 sender [ 4] 0.00-60.00 sec 994 MBytes 139 Mbits/sec receiver Done
[admin]@ perftest all- Of interest to us in this output is the very latest last part of the output1 2 3 4 5 6 7 8 9 10 11 12 13 14 15 16 17 18 19 20 21 22 23 24 25
================ SUMMARY OF RESULTS =================== ** Total Test Duration = 9.5 minutes ** (Each Test Duration = 60 sec) (Each IPSEC Test Duration = 30 sec) (WANOPT TCPPERF Test Duration= 60 sec) ** Throughput Report ** |-------------------------------------------------------| | Test Name | IF # | Fwd | Rev | |-------------------------------------------------------| | UPLINK | 0 | 130 Mbits/sec | 139 Mbits/sec | |-------------------------------------------------------| | UPLINK | 0 | 130 Mbits/sec | 139 Mbits/sec | |-------------------------------------------------------| | IPSEC Tunnel | 0 | 138 Mbits/sec | 41.1 Mbits/sec | |-------------------------------------------------------| | WANOPT | 0 | 37 Mbits/sec | 21 Mbits/sec | |-------------------------------------------------------| | SITE | 0 | 3.31 Gbits/sec | 3.99 Gbits/sec | |-------------------------------------------------------| ** Latency Report ** |--------------------------------------| | Uplink IF# | Min/Avg/Max | |--------------------------------------| | 0 | 15.729/16.115/16.503 ms | |--------------------------------------|
In this instance the difference in performance between WANOP and SITE is too big.
This is a clear indicator the WANOPT appliance, it being a bit of a resource hog most likely is residing on a datastore designed for hosting low demanding workload and therefore most likely is on low performing (spinning) disk.
This appliance needs to be sitting on SSD with a lot less latency. Please move the appliance over to a higher performing datastore and then run the test again. The data and subsequent performance of HCX should be considerably higher as a result of this action.
I hope this article provided some more insights in how to get more visibility and extract relevant data from the various appliances together forming the HCX service mesh.